
Outputs
Display of outputs is performed by EcoStruxure Power Monitoring Expert or Power Operation except in specified cases.
The following outputs, when used as part of an energy management program, can help normalize energy data with respect to business operations (number of items produced, etc.) that drive energy usage.


Events and Alarms
In EcoStruxure Power Monitoring Expert smart setpoints offer threshold-based alarming on energy usage.
Trends
Energy Usage Trending
All input data detailed above can be displayed as trends.
 |
|
Energy Usage Trending |
Dashboards
All dashboards can be configured to run automatically in slide show mode to perform the function of an Energy Kiosk.
Key Performance Indicator Dashboards*
Dashboards to visualize, analyze, and communicate information about an organization's energy performance KPIs for continuous energy improvement
 |
|
KPI Dashboard |
Reports
The following reports can be displayed or automatically sent by email:
Energy Management Reports:
-
Energy Usage by Shift
Compares a measurement from multiple devices for specified time periods (or shifts). This means energy usage can be compared between shifts (for example, 6:00 to 1:00 vs. 1:00 to 8:00).
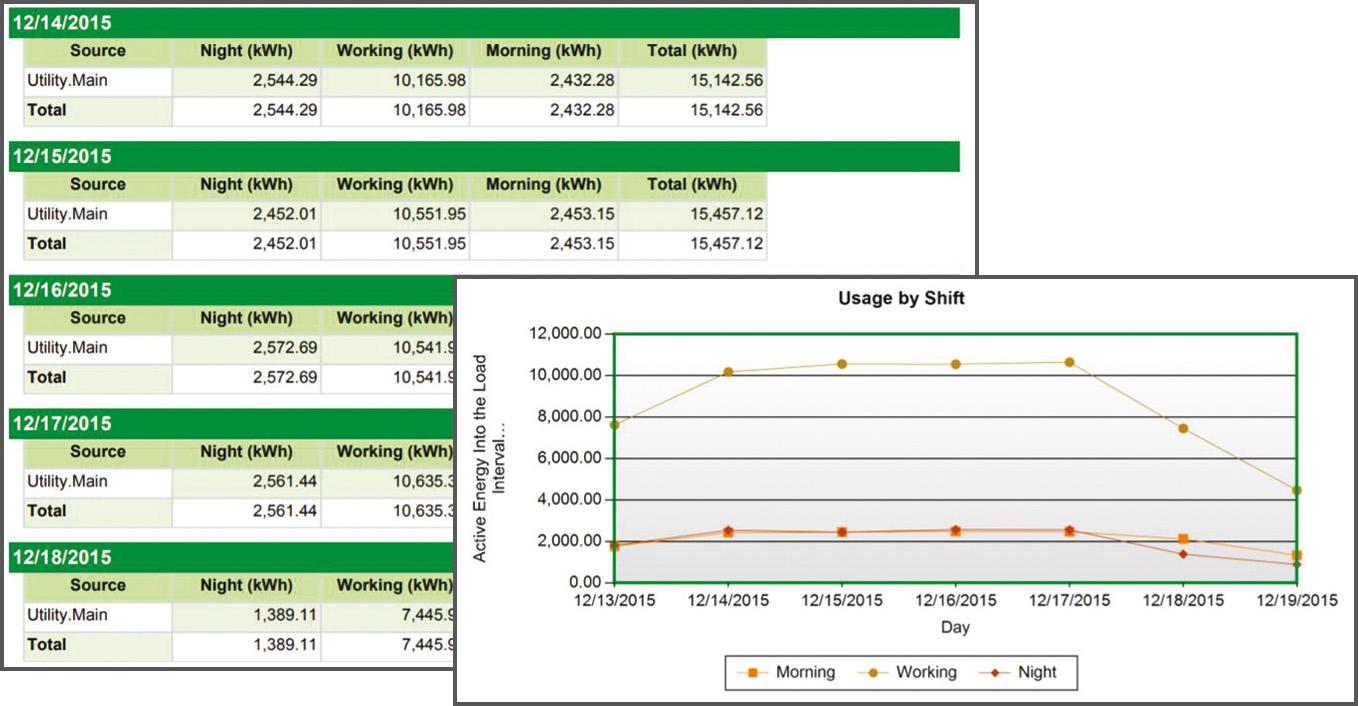
Energy Usage by Shift
Energy Analysis Reports:*
-
Power Usage per State Report
Details power usage per state of operation of a machine or process.

Power Usage per State Report
-
Energy Consumption per State Report
Details energy consumption per state of operation of a machine or process.

Energy Consumption per State Report
-
Duration Curve Report
Shows distribution of power consumption versus duration to detect potential capacity or utilization issues.

Duration Curve Report
-
KPI Engine Report
Calculates complex energy KPIs.

KPI Engine Report
-
Power Usage Effectiveness (PUE) Report (for data centers)
Displays and analyzes Power Usage Effectiveness by day, week, month and year.
Compares the IT loads and support loads.

PUE Report (Data Center)
-
Multi-equipment Operation Report
Compares duration per state, per machine or process.

Multi-equipment Operation Report
-
Single Equipment Operation Report
Compares duration per state for a single machine or process.

Single Equipment Operation Report
Usage Trending Reports:
-
Multi Device Usage Report
Displays consumption information for multiple devices.
View energy usage for a single period, or compare two periods, for example, this month versus last month.

Multi Device Usage Report
-
Single Device Usage Report
Displays energy information for one device.
View energy usage for a single period, or compare two periods, for example, this month versus last month.

Single Device Usage Report
Cloud-Based Analytics and Services
As an option, EcoStruxure Service Plan powered by EcoStruxure Power Advisor provides data quality analytics with recommendations from our Schneider Electric service experts.
For further information, refer to Data Quality Management.
 |
|
EcoStruxure Service Plan Powered by EcoStruxure Power Advisor Platform |
 |
 |
|
EcoStruxure Power Advisor Data Quality Report - Overall Score |
EcoStruxure Power Advisor Data Quality Report - Device Details by Issue |