
Using the Standard Web Server User Interface
Overview
This chapter describes the functions of the standard Web server pages and how to use the data to operate an LTMR controller with or without an LTME expansion module.
Description of the Standard Web Server User Interface
Overview
The standard Web server pages provide an LTMR embedded HMI which can be accessed using a standard web browser supported by:
-
Microsoft Internet Explorer version 8 or later
-
Mozilla Firefox version 13 or later
-
Google Chrome version 19 or later
Java Free Web Pages
The latest versions of web pages are developed on a technology called as Lightweight Web App (LWA). The web pages are independent from Java backbone, works under any environment (XP, Windows 7, Windows 8, and so on), and also on all web browsers (Microsoft Internet Explorer, Mozilla Firefox, and Google Chrome). TeSys T new web pages works on PC without Java installation.
Functions of the Web Server User Interface
The following table describes all the functions of the Web server pages. Some functions are available according to the configuration (for example functions available only if LTME is connected).
|
Menu |
Information Displayed |
Function |
|---|---|---|
|
HOME |
Home page |
Identification of the connected product: LTMR controller with/without LTME expansion module |
|
Language |
Display of the pages in the selected language |
|
|
Identification |
Activation and deactivation of data modification mode |
|
|
DOCUMENTATION |
References |
Link to the https://www.se.com website |
|
MONITORING |
Product status |
Display of information from input/output status and the internal product status |
|
Metering |
Display of measured data with numerical value and graphical representation |
|
|
DIAGNOSTICS |
Ethernet basic diagnostics |
Display of information on the IP parameters, FDR, device name and the protocol |
|
Ethernet extended diagnostics |
Display of communication statistics for each port |
|
|
RSTP bridge |
Display and reset (password-protected) of statistics |
|
|
RSTP port |
Display and reset (password-protected) of statistics and status for the ports 1 and 2 |
|
|
Trips and Alarms |
Display Trips, and Alarm status. Alarm and trips count, if any. |
|
|
Trip history |
Display and reset (password-protected) of the thermal, current, voltage, and power detected trip history |
|
|
MAINTENANCE |
Counters |
Display of statistics |
|
SETUP* |
Thermal settings |
Display thermal settings |
|
Current settings |
Display current settings |
|
|
Voltage settings |
Display voltage settings |
|
|
Power settings |
Display power settings |
|
|
RSTP settings |
Display RSTP settings |
|
|
Communication |
Display communication settings |
Standard Web Server Structure

Access to the Standard Web Server
|
Step |
Action |
|---|---|
|
1 |
Connect the LTMRModbus/TCP controller to your PC. |
|
2 |
Open a Web browser. |
|
3 |
In the address bar, enter the IP address assigned to the LTMR controller. If necessary, refer to the LTMR IP addressing procedure IP Addressing. |
|
4 |
If connection is accepted, the Home page displays. You can navigate in the different pages via menus and submenus. |
Standard Web Server User Interface
All Web server pages have the same appearance. A window is divided into three areas, as follows:

|
Legend |
Area |
Description |
|---|---|---|
|
1 |
Menus |
Banner displayed on every page, showing links to the menus:
|
|
2 |
Submenu treeview |
Links to the pages related to the selected menu. The treeview
|
|
3 |
Page body |
Information related to the contextual page selected in the menu or submenu. |
Home Page
Overview

Access to the Home Page
The Home page is displayed:
-
After you connect to the standard Web server,
-
When you click Home in the menu headers at any moment during navigation and from any page displayed.
Home Page Submenu
The Home page submenu contains the following items:
|
Level 1 |
Level 2 |
Function |
|---|---|---|
|
Languages |
English |
Switch the page language to English |
|
French |
Switch the page language to French |
|
|
Spanish |
Switch the page language to Spanish |
|
|
Custom |
Switch the page language to the Custom language (English by default) |
|
|
Identification |
Login |
Display the Login page to enter the password |
|
Logout |
Deactivate the data modification mode |
Language Selection
From the submenu zone, click one of the following languages to display the page content in this language:
-
English
-
French
-
Spanish
-
Custom (English by default)
Home Page Body
The Home page displays the following product elements:
-
A view of the LTMR controller and LTME expansion module when connected
-
LTMR controller data:
-
Vendor name: Schneider Electric
-
Commercial reference
-
Version
-
-
Version of the communication interface
-
LTME expansion module data:
-
Commercial reference
-
Version
-
DISCOVER button
-
DISCOVER Button
The DISCOVER button is displayed in the following pages:
-
Home page
-
Documentation page
-
Monitoring page
-
Diagnostics page
-
Maintenance page
-
Setup page
When clicking this button, the Network status LED of the LTMR controller blinks 10 times alternatively red and green.
There is no visual modification on the Web page.
Documentation Page
Overview

Access to the Documentation Page
The Documentation page displays when you click Documentation in the menu headers at any moment during navigation and from any page displayed.
Documentation Page Submenu
The Documentation page submenu allows you to access the References page. You can download LTMR technical publications and other technical information from our website at www.se.com using the hyperlink on the References page.
Monitoring Page
Overview

Access to the Monitoring Page
The Monitoring page displays when you click Monitoring in the menu headers at any moment during navigation and from any page displayed.
Monitoring Page Submenu
The Monitoring page submenu allows you to access the following pages:
-
Product Status Product Status Page
-
Metering Metering Page
Product Status Page
Overview

Product Status Page Body
The page displays
-
the state of each I/O related to the dedicated connector pin on the product view (LTMR controller + LTME expansion module),
-
general states and values.
The state indicators depend on the following color code:
-
Inactive states are in gray.
-
Active states are in green, orange, or red depending on the data.
The Product Status page contains the following read-only data:
|
Data Name |
Parameter Name |
|---|---|
|
LI1 |
Logic Input 1 |
|
LI2 |
Logic Input 2 |
|
LI3 |
Logic Input 3 |
|
LI4 |
Logic Input 4 |
|
LI5 |
Logic Input 5 |
|
LI6 |
Logic Input 6 |
|
LI7* |
Logic Input 7 |
|
LI8* |
Logic Input 8 |
|
LI9* |
Logic Input 9 |
|
LI10* |
Logic Input 10 |
|
LO1 |
Logic Output 1 |
|
LO2 |
Logic Output 2 |
|
LO3 |
Logic Output 3 |
|
LO4 |
Logic Output 4 |
|
Wiring Trip |
Wiring Trip |
|
System Ready |
System Ready |
|
System ON |
System ON |
|
System Trip |
System Trip |
|
System Alarm |
System Alarm |
|
Trip Reset Authorized |
Trip Reset Authorized |
|
Power Cycle Required |
Power Cycle Required |
|
Minimum Wait Time |
Minimum Wait Time |
|
Time To Thermal Trip |
Time To Trip |
|
Motor Starting |
Motor Starting |
|
Motor Running |
Motor Running |
|
High Speed |
High Speed |
|
Direction 1* |
Direction 1 |
|
Direction 2* |
Direction 2 |
|
Average Current (%FLC) |
Average Current |
|
Average Current (A) |
Average Current |
Metering Page
Overview

Metering Page Body
The page displays the numerical value and graphical representation next to each data name.
The Metering page contains the following read-only data:
|
Group Name |
Data Name |
Parameter Name |
|---|---|---|
|
Thermal |
Thermal Capacity Level |
Thermal Capacity Level |
|
Motor Temperature |
|
|
|
Current |
Average Current |
Average Current |
|
Ground Current |
Ground Current |
|
|
Current Phase Imbalance |
Current Phase Imbalance |
|
|
Voltage |
Average Voltage* |
Average Voltage |
|
Frequency* |
Frequency |
|
|
Voltage Phase Imbalance* |
Voltage Phase Imbalance |
|
|
Power |
Active Power* |
Active Power |
|
Power Factor* |
Power Factor |
|
|
Reactive Factor* |
Reactive Power |
Diagnostics Page
Overview

Access to the Diagnostics Page
The Diagnostics page displays when you click Diagnostics in the menu headers at any moment during navigation and from any page displayed.
Diagnostics Page Submenu
The Diagnostics page submenu allows you to access the following pages:
|
Level 1 |
Level 2 |
|---|---|
|
Ethernet |
Basic Ethernet Basic Page |
|
Extended Ethernet Extended Diagnostics Page |
|
|
RSTP |
RSTP Bridge RSTP Bridge Statistics Page |
|
RSTP Port RSTP Port Statistics Page |
|
|
Product |
Trips & Alarms Trips & Alarms Page |
|
Trip & Alarm History Trip History Page |
Ethernet Basic Page
Overview
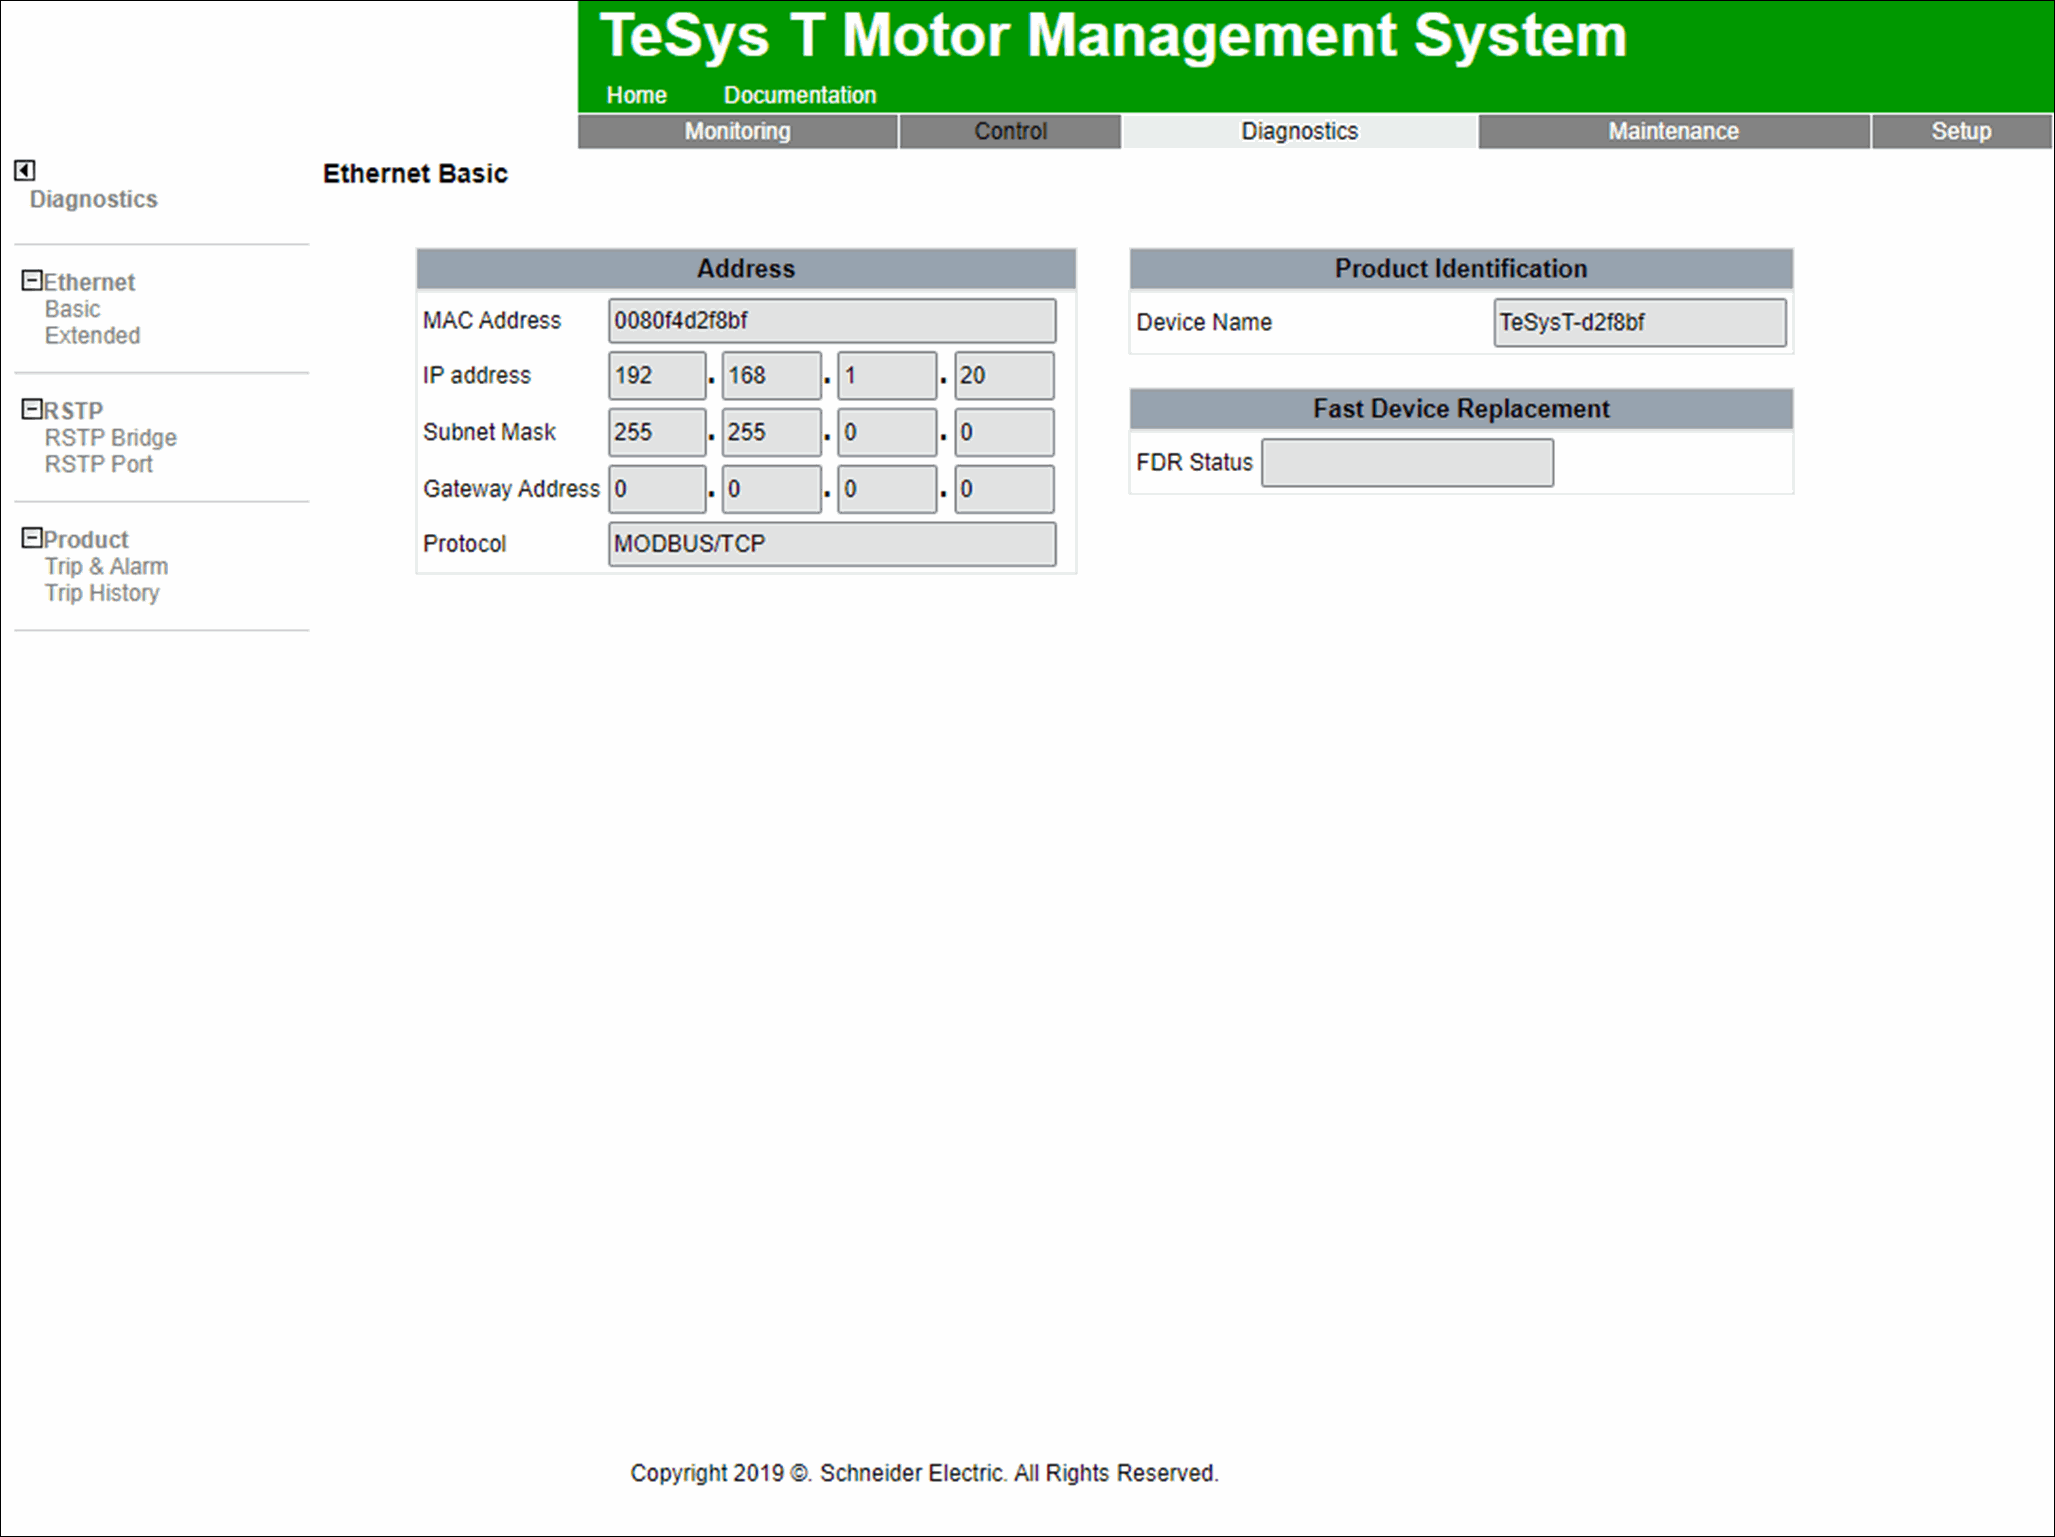
Ethernet Basic Page Body
The Ethernet Basic page contains the following read-only data:
|
Group Name |
Data Name |
Parameter Name |
|---|---|---|
|
Address |
MAC Address |
Ethernet MAC Address |
|
IP Address |
Ethernet IP Address |
|
|
Subnet Mask |
Ethernet Subnet Mask |
|
|
Gateway Address |
Ethernet Gateway Address |
|
|
Protocol |
Ethernet Capabilities Control |
|
|
Product Identification |
Device Name |
Ethernet Device Name |
|
Fast Device Replacement Status |
FDR Status |
Network Port FDR Status |
Ethernet Extended Diagnostics Page
Overview

Ethernet Extended Diagnostics Page Body
In the Port Number list, select the Ethernet port to display the related diagnostics.
The Ethernet Extended Diagnostics page contains the following read-only data for each port:
|
Group Name |
Data Name |
|---|---|
|
Transmit Statistics |
Frames Transmitted OK |
|
Collisions |
|
|
Excessive Collisions |
|
|
Carrier Sense Errors |
|
|
Link Speed |
|
|
Duplex Mode |
|
|
Receive Statistics |
Frames Received OK |
|
CRC Errors |
RSTP Bridge Statistics Page
Overview

RSTP Bridge Statistics Page Body
The RSTP Bridge Statistic page contains the following data:
|
Group Name |
Data Name |
|---|---|
|
General |
Bridge Status |
|
Bridge ID |
|
|
Designated Root ID |
|
|
Designated Root Port |
|
|
Rootpath Cost |
|
|
Total Topology Changes |
|
|
Configured vs. learned |
Configured Hello Time |
|
Learned Hello Time |
|
|
Configured Forward Delay |
|
|
Learned Forward Delay |
|
|
Configure Max Age |
|
|
Learned Max Age |
RSTP Port Statistics Page
Overview

RSTP Port Statistics Page Body
In the Port Number list, select the RSTP port number in the field to display the related diagnostics.
The RSTP Port Statistics page contains the following data for each port:
|
Group Name |
Data Name |
|---|---|
|
Port Status |
Status |
|
Role |
|
|
Priority |
|
|
Port Path Cost |
|
|
Designated Port ID |
|
|
Received RSTs |
|
|
Transmitted RSTs |
|
|
Received Configure |
|
|
Transmitted Configure |
|
|
Received TCNs |
|
|
Transmitted TCNs |
Trips & Alarms Page
Overview

Trips & Alarms Page Body
The following items are displayed next to each data name: the alarm or trip status and the trips counter value, if any.
The color code of the indicators is as follows:
|
In Case of... |
The Indicator is... |
|---|---|
|
alarm |
Orange |
|
Trip |
Red |
|
Inactive alarm or trip |
Gray |
The Trips & Alarms page contains read-only data.
Trip History Page
Overview

Trip History Page Body
In the Trip History list, select a trip number to display the history of LTMR controller data recorded at the time of the last five detected trips. Trip N0 contains the most recent trip record, and trip N4 contains the oldest retained trip record.
The Trip History page contains the following read-only parameters for trip N0:
|
Group Name |
Data Name |
Parameter Name |
|---|---|---|
|
Trip Selection |
Date-Time |
Date and Time N0 |
|
Trip Code |
Trip Code N0 |
|
|
Current |
FLC max |
Full Load Current max |
|
FLC Ratio |
Motor Full Load Current Ratio |
|
|
Average Current |
Average Current N0 |
|
|
L1 Current |
L1 Current N0 |
|
|
L2 Current |
L2 Current N0 |
|
|
L3 Current |
L3 Current N0 |
|
|
Ground Current |
Ground Current N0 |
|
|
Average Current Ratio |
Average Current ratio N0 |
|
|
L1 Current Ratio |
L1 Current Ratio N0 |
|
|
L2 Current Ratio |
L2 Current Ratio N0 |
|
|
L3 Current Ratio |
L3 Current Ratio N0 |
|
|
Ground Current Ratio |
Ground Current Ratio N0 |
|
|
Current Phase Imbalance |
Current Phase Imbalance N0 |
|
|
Thermal |
Thermal Capacity |
Thermal Capacity Level N0 |
|
Motor Temp Sensor |
Motor Temperature Sensor Degree N0 |
|
|
Voltage |
Average Voltage |
Average Voltage N0 |
|
L1-L2 Voltage |
L1L2 Voltage N0 |
|
|
L2-L3 Voltage |
L2L3 Voltage N0 |
|
|
L3-L1 Voltage |
L3L1 Voltage N0 |
|
|
Voltage Phase Imbalance |
Voltage Phase Imbalance N0 |
|
|
Frequency |
Frequency N0 |
|
|
Power |
Active Power |
Active Power N0 |
|
Power Factor |
Power Factor N0 |
Trips N1–N4 trip record information in the same way as Trip N0. See corresponding N1–N4 parameters.
Maintenance Page

Counters Page
Overview

Counters Page Body
The Counters page contains the following read-only data:
|
Group Name |
Data Name |
Parameter Name |
|---|---|---|
|
Control Unit Statistics |
MaxTemperature |
Controller Internal Temperature Maximum |
|
LO1 Closing Count |
Motor LO1 Closings Count |
|
|
LO2 Closing Count |
Motor LO2 Closings Count |
|
|
Last Power OFF Duration |
Controller Last Power OFF Duration |
|
|
Motor Statistics |
Operation Time |
Operating Time |
|
Starts Count |
Motor Starts Count |
|
|
Starts Per Hour |
Motor Starts Per Hour Count |
|
|
Last Start |
Level |
Motor Last Start Current Ratio |
|
Duration |
Motor Last Start Duration |
Setup Page
Overview

Functionality
All SETUP web pages functionality has been disabled for Cybersecurity.
Access to the Setup Page
The Setup page displays when you click Setup in the menu headers at any moment during navigation and from any page displayed.
Setup Page Submenu
The Setup page submenu allows you to access the following pages:
|
Level 1 |
Level 2 |
|---|---|
|
Product |
Thermal Product Thermal Settings Page |
|
Current Product Current Settings Page |
|
|
Voltage Product Voltage Settings Page |
|
|
RSTP Configuration RSTP Configuration Page |
|
|
Communication Communication Page |
|
|
Security |
Password |
Product Thermal Settings Page

Product Current Settings Page

Product Voltage Settings Page

Product Power Settings Page

RSTP Configuration Page

Communication Page
Overview

Communication Page Body
The Communication Settings page contains the following (password-protected) data:
|
Group Name |
Data Name |
|---|---|
|
Communication Parameters |
IP Address |
|
Subnet Mask |
|
|
Gateway Address |