
Risk Matrix
TheEcoStruxure™ Grid Asset Performance solution provides different tools to show risk analyses results in terms of per number of assets, per local currency per year, and more. One tool is the Risk Matrix.
The Risk Matrix uses the combined values of the Health Index (HI) and Criticality Index (CI) to create a colored grid that represents a clear and understandable insight about the assets’ overall situation. It enables users to make OPEX (operating expenditures) and CAPEX (capital expenditures) decisions around replacement versus maintenance. The grid in each workspace can be customized to show different health and criticality bands, numbers of assets, and the physical layout properties of the grid.
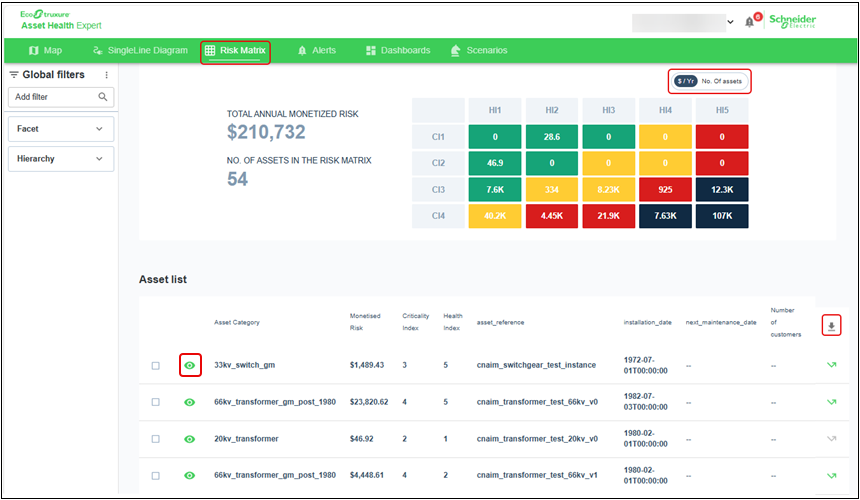
When you click the Risk Matrix tab, the window shows the assets related to that workspace. A single click can toggle the currency and number of assets in the grid, download a file with the asset list, and get details of specific assets. The asset list table shows more information about the analytics results, according to the filter, selected risk cell, criticality rows, or health index columns. Some examples of column options include:
-
Asset category
-
Monetized risk
-
Criticality Index
-
Health Index
-
Asset Reference
-
Installation Date
-
Next Maintenance Date
-
Number of customers
-
Asset Advanced Properties
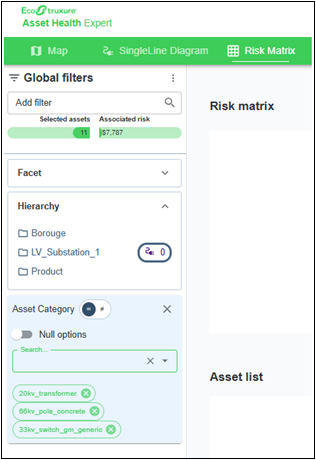
You can also change the filters to narrow down the information seen. Here are the options that can be changed:
-
Search or select assets from the global filter combo-boxes.
-
Click one cell, row, or column to see the HI and CI combination of those assets.
You can see the asset list change to reflect the highlighted rows and columns.
-
Use the columns in the Asset List and click the header to change the order in each column.
-
Click the down arrow on the far right side of the header row to download the Asset List as a CSV file.
-
Click the
 button to see the asset details window.
 -
Click the box of an individual box, row, column, or a combination of boxes, to select the asset, or assets, and the risk matrix shows the location of the selection within the matrix and indicates the total annual monetized risk and the number of selected assets. Multiple assets can be selected to filter the matrix.