Diagnostics
The Diagnostics tab provides a detailed breakdown of the actions that GDBM took while processing versions. This can help administrators determine where an error occurred during version processing. These logs include details such as action handlers processed, errors encountered, exceptions, and timestamps for each item listed in the log. These logs are also helpful when reaching out to the Schneider Electric Support team for assistance.
To view a list, select a Scheduled Event from the drop-down. Once a Scheduled Event is selected, the list automatically updates and displays any version names associated to the Scheduled Event. If there are no logs for the selected Scheduled Event, you are notified that no results were returned.

Use the drop-down on the right to select a time range to display
log messages from that time frame. Click the Refresh  button
to update the list after selecting a new time range.
button
to update the list after selecting a new time range.

To define a different time range from the options in the drop-down,
select Custom from the list. The Specify Custom Time Range  button activates to the left of the drop-down. Click the Specify
Custom Time Range button to display the dialog to specify the Start and End Dates
and time frame. You can manually type the date in or use the calendar
to select the date. Use the drop-downs to select the hour, minute,
and AM or PM. When you have the Start Date and End Date specified
as you want, click apply. The log message list updates to display
the log messages within the specified time frame.
button activates to the left of the drop-down. Click the Specify
Custom Time Range button to display the dialog to specify the Start and End Dates
and time frame. You can manually type the date in or use the calendar
to select the date. Use the drop-downs to select the hour, minute,
and AM or PM. When you have the Start Date and End Date specified
as you want, click apply. The log message list updates to display
the log messages within the specified time frame.

Diagnostics displays a maximum of 200 logs. If your results contain more than 200 logs, a message displays stating “Maximum number of results returned, some data may not be shown. Narrow your query to reduce results returned.” At this point, we recommend that you apply additional filters to narrow your results.
You can filter the log list to show only certain kinds of log messages.
Click the Filter  button to display the filter options.
The message type filters available are Information, Warning, and Error.
A green toggle under the filter indicates that the filter is visible.
A white toggle indicates that the filter is not visible. The moment
you toggle a selection on or off, the list automatically updates itself.
You can also click Unselect All to turn off all filter options, or
Select All to turn on all filter options at once.
button to display the filter options.
The message type filters available are Information, Warning, and Error.
A green toggle under the filter indicates that the filter is visible.
A white toggle indicates that the filter is not visible. The moment
you toggle a selection on or off, the list automatically updates itself.
You can also click Unselect All to turn off all filter options, or
Select All to turn on all filter options at once.

If the applied filters hide all the results (for example, you turn off the Information, Warning, and Error filters at the same time), a message is displayed notifying you all the logs are currently hidden.

Additionally, you can use the Search bar at the top of the Solution Center dialog to filter the log list. As you type in the Search bar, the list automatically starts to filter to matching results.
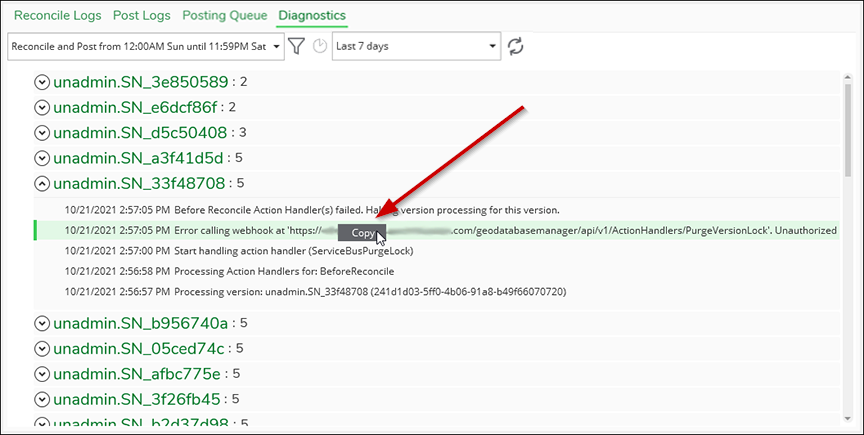
The number displayed after each version name indicates the number of log messages for the version. A log message is a step GDBM ran in the process. To view the list of log messages, click the down arrow next to a version name.

Log messages for a version include items such as when processing began and ended for the version, which action handlers were processed (including when they started and completed running), if a reconcile message was sent, any errors, and failures.
Failure messages show additional details of the last run such as the URL, and a Reason and Summary for the failure.
You can copy a log message line by selecting the line, right-click on the selected line, then click copy.