
Run History
The Run History tab displays the execution details of all dynamic
workflows. It provides information about a workflow that is currently
running, has completed, or has failed. This tab also has buttons indicating
the type of each workflow in the list: client dynamic workflow  buttons and hosted dynamic workflow
  buttons.
The Run History is voluminous, especially when you have many users on many different XI series applications. So first, let’s discuss searching and filtering the history.
Workflow Filters
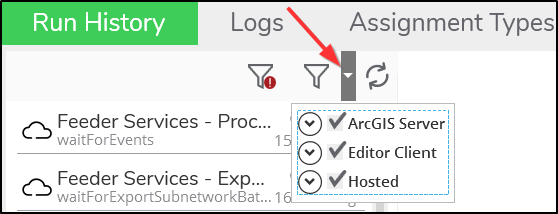
At the top of the list are two filters.

-
View Only Workflows with Errors: This reduces the list to only dynamic workflows that have encountered an error.
-
Filter Workflows by Type: This allows you to filter the list by workflow. You can pick one or more workflows (the image below is just an example, and you likely have more choices).
Workflow Search
The Search field at the top of the interface allows you to search by Design ID, Session ID, or Markup ID, to filter the list of workflow entries. The Search field uses Cosmos DB language, so the best way to search is to let the application provide the syntax for you. To do so, follow these steps:
-
In your XI series application (such as ArcFM Mobile, Designer XI, and Editor XI), locate the design, session, or markup that passed through (or is currently passing through) a dynamic workflow.
-
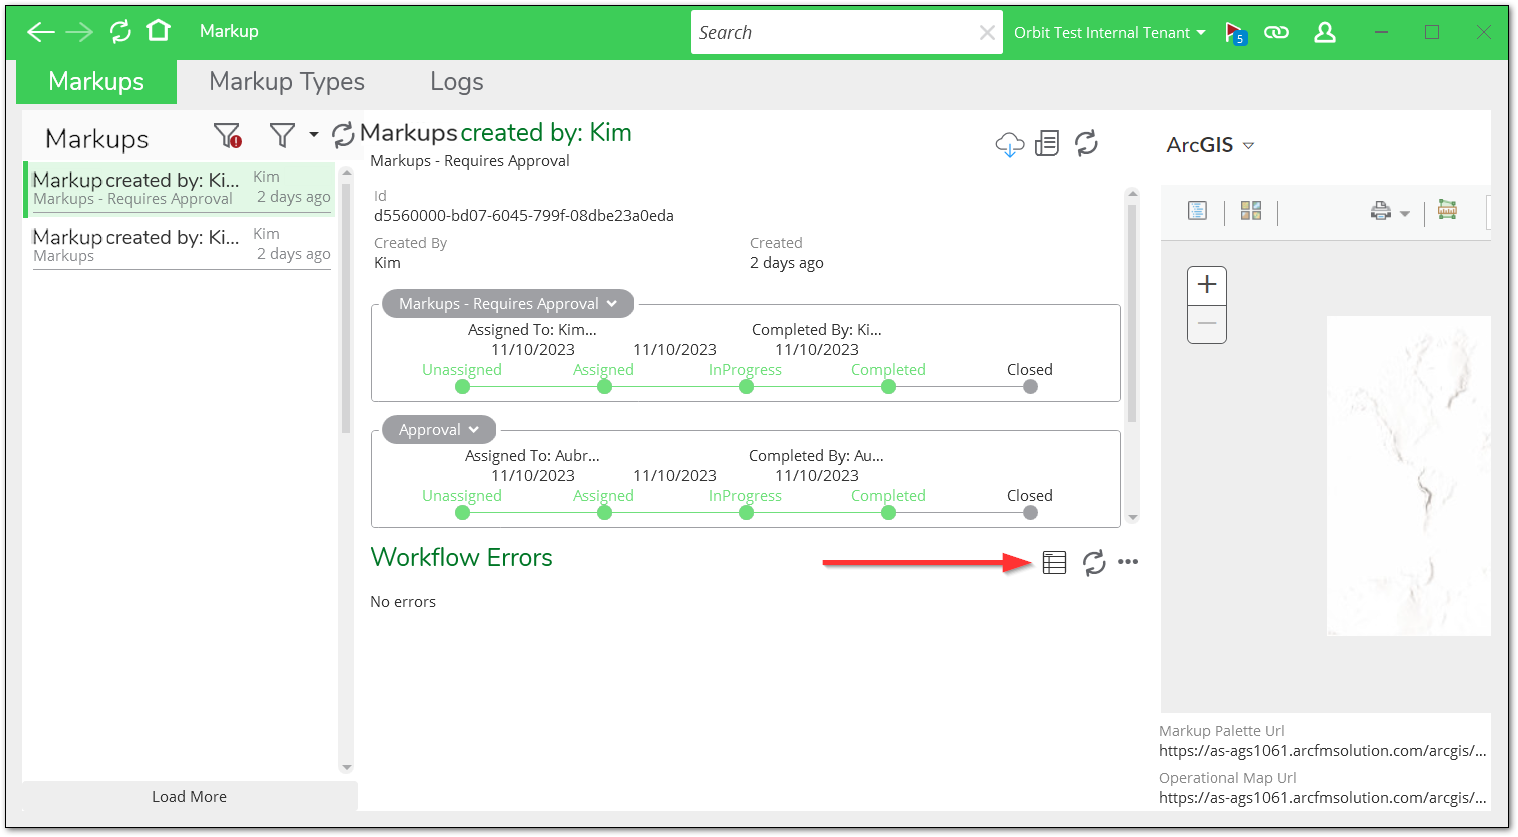
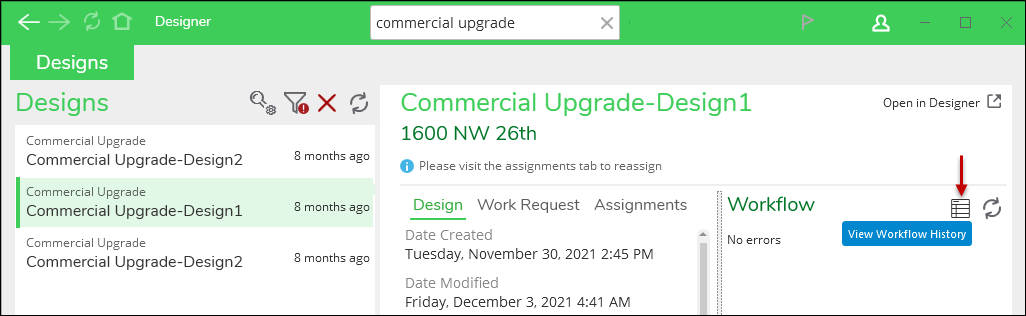
Click the design, session, or markup to highlight it in green. Then, click the View Workflow History
 button. Here are a few examples from various XI series applications:
-
ArcFM Mobile:
-
Designer XI:
-
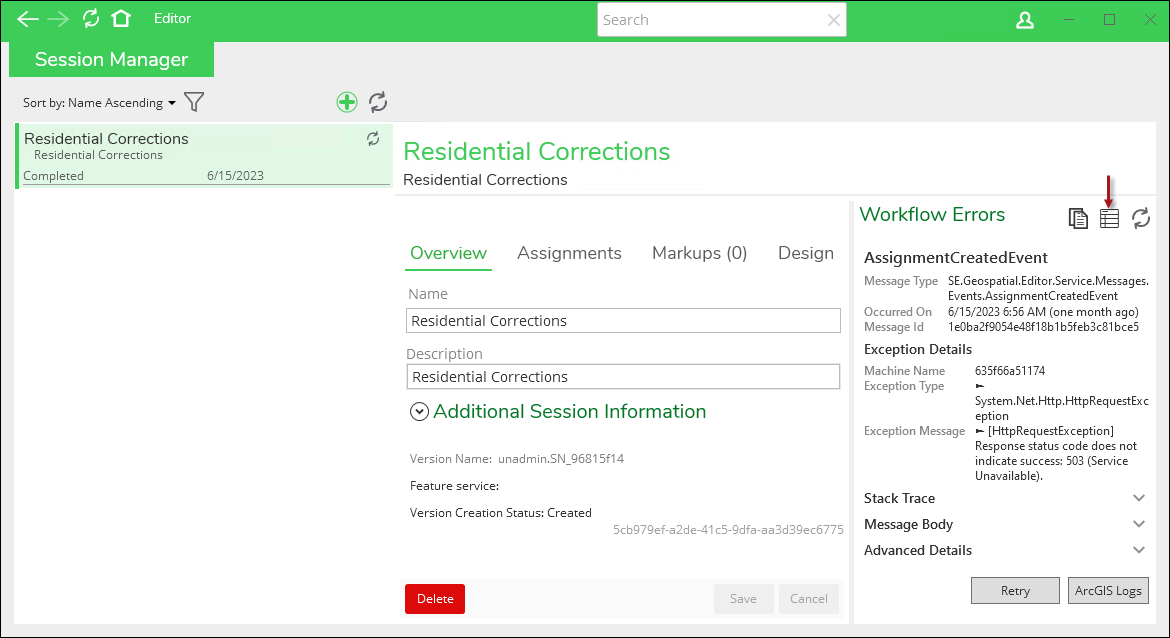
Editor XI:
-
-
This View Workflow History button toggles you back to the Workflows plugin > Run History tab, and it populates the Search field with the appropriate ID. You are now ready to explore the dynamic workflow further.

Workflow Information
When viewing an executed workflow, there are multiple methods to view information.
-
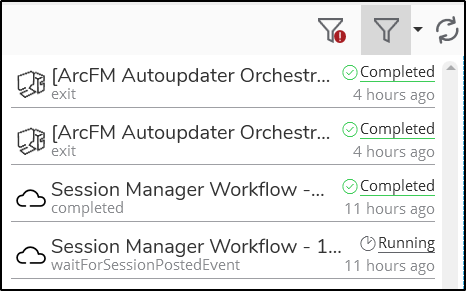
The list of executed workflows provides high-level information at a glance, including current status, current state of the workflow, and last updated time. The status of each run is underlined, and Failed statuses show an X.
-
After clicking a workflow to highlight it in green, the middle pane of the interface provides up to four subtabs, depending on which type of workflow you are viewing: Input, Current Status, Output, and Graph. The Current Status subtab is visible only with hosted workflows. Further, it provides a View Logs
 tool, which toggles you to the Logs tab pre-filtered to the chosen
workflow.
tool, which toggles you to the Logs tab pre-filtered to the chosen
workflow.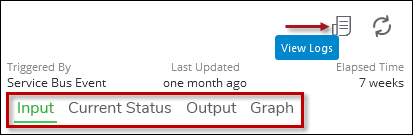
-
Regarding the Input, Current Status, and Output subtabs, there is an object called the “Context” that you interact with while writing a workflow. The Input shows what the Context object was when the workflow began, the Current Status shows what the Context object is at the given moment, and the Output shows you what the Context object looked like when the workflow completed (or the error message if the workflow failed).
-
Within all four subtabs, you can view the “State” property (for the Output to be populated, the workflow must have completed or have an error). This is an important section because it holds all of the current values of variables that have been stored during the workflow run. When troubleshooting, it is useful to look at the collected values in addition to the current node. This can reveal why and how the workflow took its chosen path and what caused the error.
-
Within all four subtabs, you can view the “Event” property. This holds the .json of the service bus event that triggered the workflow.
-
-
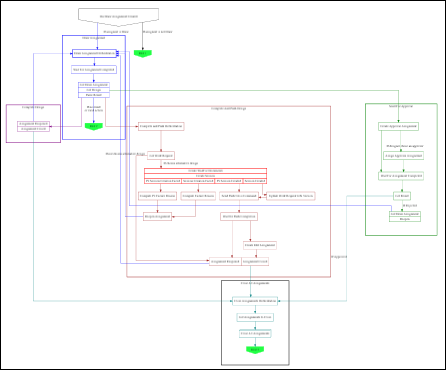
The right-hand pane displays the architecture of the workflow, which is known as the graph.
-
Click and drag to pan around the graph.
-
Roll the mouse wheel to zoom in and out.
-
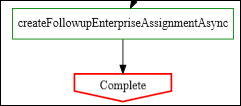
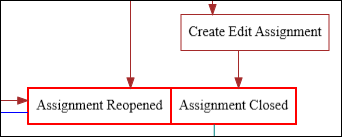
Notice the current node (or status) of the executed workflow is highlighted in red.
-
For example, this workflow completed, so the “Complete” node is highlighted in red.
-
As another example, this workflow is currently waiting for the draw assignment to complete, so the “Assignment” nodes are highlighted in red.
 NOTE: If you're investigating a failed workflow, the graph section shows the step where the workflow stopped outlined in red.
-
-
-
You can also copy the Running Workflow Id and Workflow Metadata Id using the Copy to Clipboard buttons, to assist in data analysis and troubleshooting. If you are working with an autoupdater orchestration workflow, you additionally have the Workflow Ancestral ID available to Copy to Clipboard.

Recomplete Edit Assignment Tool
Sometimes a session may get stuck along its workflow and not complete its edit assignment. A user may create a session and complete work on the session, send for approval, but the session does not show up in the approval assignment or review assignment. When this happens, the Recomplete Edit Assignment tool helps to complete that edit assignment.
-
Within the Run History tab, locate the Session Manager Workflow that has failed. You can easily find this workflow by filtering for workflows with errors.
-
Locate the Tools drop-down and expand its list.

-
Click the Recomplete Edit Assignment button.
-
Go to the Editor plugin > Session Manager tab, and locate the session you just executed this workflow upon. Note that its Edit assignment says completed.
